Understanding Distributed Tracing
24 September 2024

Distributed Tracing is a technique to keep track of requests as they flow from the frontend layers through a complex distributed backend systems, Mainly those built in a microservices architecture.
How Distributed Tracing Works
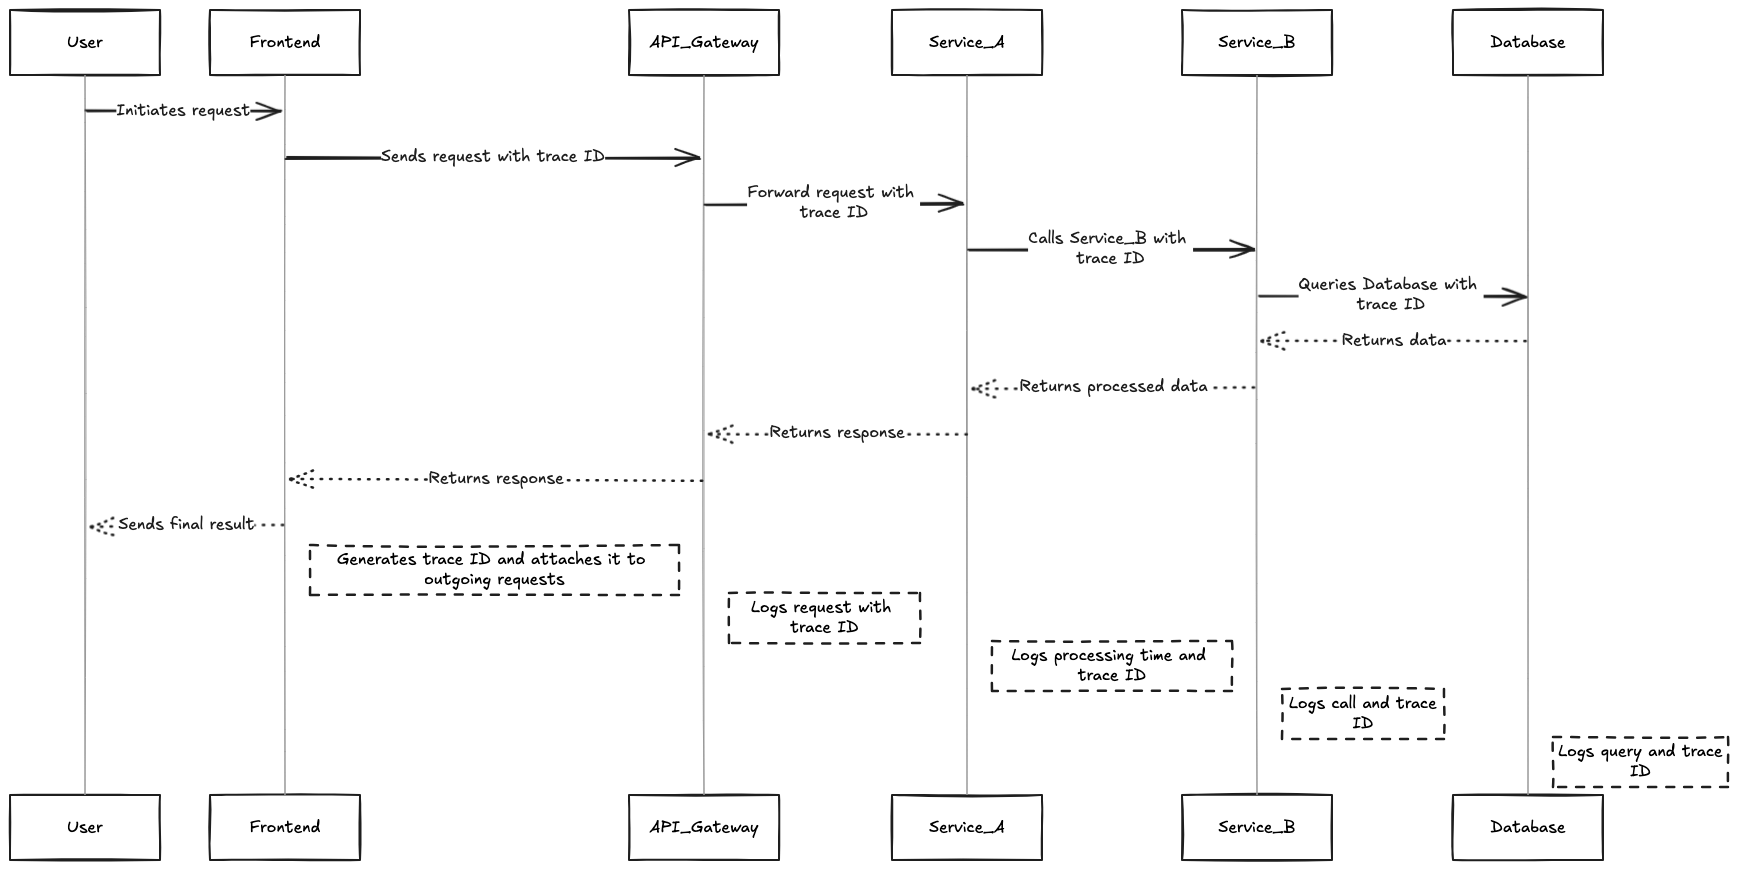
- Request Initiation: When a request is initiated (e.g., a user submits a form), it is assigned a unique identifier known as a
Trace ID. This Trace ID remains with the request throughout its lifecycle across multiple distributed services.
- Span Creation: As the request moves through different services, each service generates
spans, which are individual units of work representing operations performed during the request’s journey. Each span includes:
- Start and End Timestamps: To measure the duration of the operation.
- Span ID: A unique identifier for each span.
- Metadata: Additional information such as service name, operation type, and error status.
- Data Collection: Each service logs its span data, associating it with the original
Trace ID. This allows for the reconstruction of the entire request flow, enabling developers to see how requests interact with various services and where delays or errors occur
- Visualization: Distributed tracing tools often visualize this data using diagrams. These visualizations help identify performance bottlenecks by showing where time is spent within each service and how services interact.
Here is a diagram explaining the above steps
Benefits of Distributed Tracing
- Analyze request flows within a complex architecture to detect latency issues and optimize performance.
- We can quickly identify where failures occur within complex service interactions.
- Measure key user actions and identify backend bottlenecks affecting user satisfaction
- Faster resolution of issues by easily locating the failures within a complex service interactions.
Key Components of Distributed Tracing
Trace ID: A unique identifier that ties together all spans associated with a single request.Trace: A tree of spans that shows the path that a request makes through an app. The root span is the first span in a trace.Span: Represent individual operations within a trace, capturing details about each step taken by the system.Instrumentation: The process of modifying application code to generate tracing data. frameworks like OpenTelemetry facilitate this.